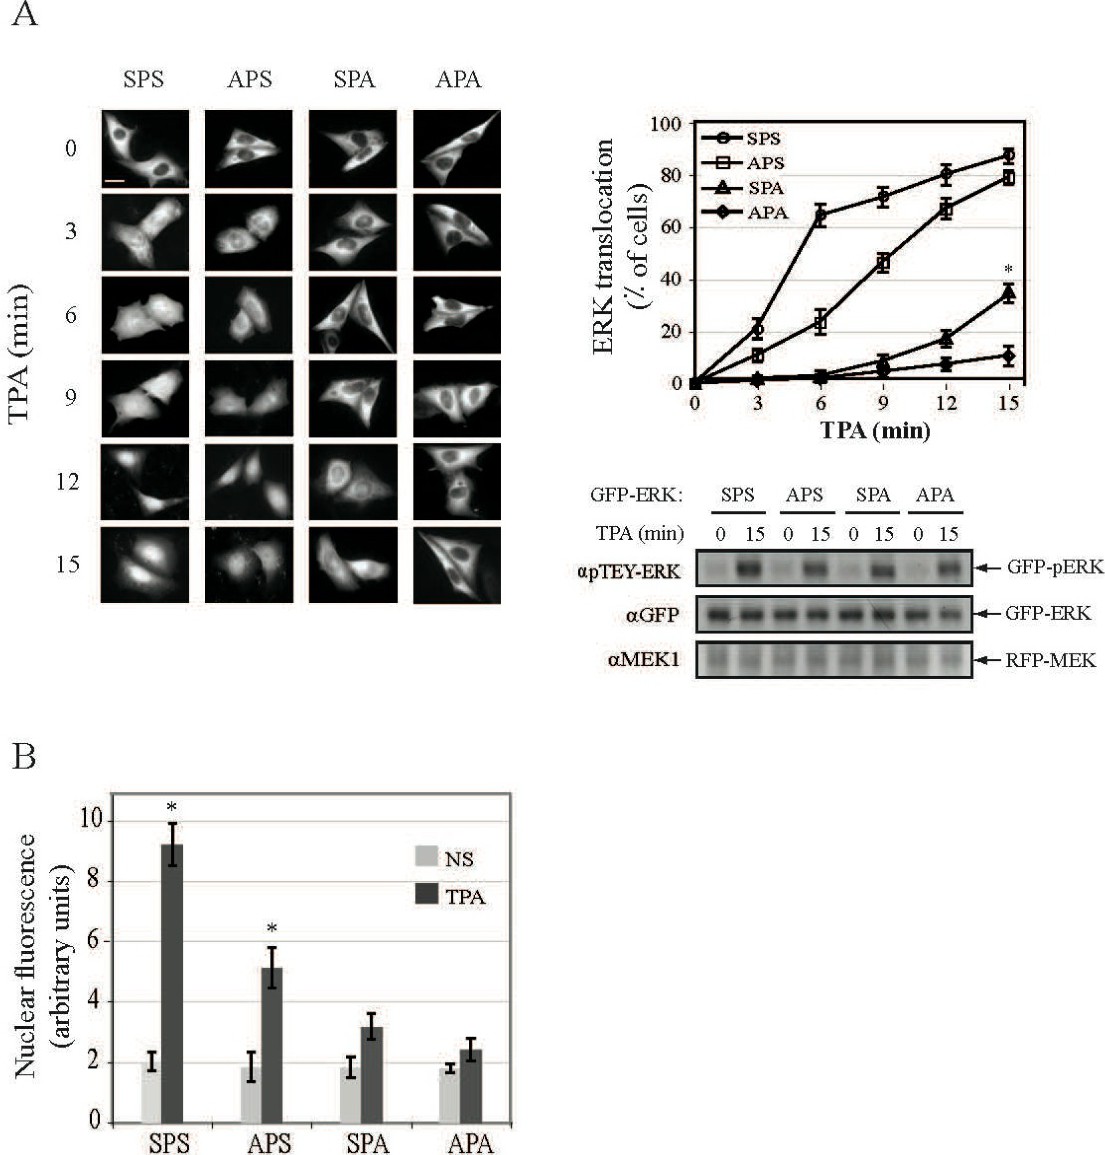
Fig. 5. Kinetics of NTS-mutated ERK translocation into the nucleus. (A) CHO cells were co-transfected with RFP-MEK1 and the indicated GFP-ERK2 constructs. Thirty-six h after transfection the cells were serum-starved and then stimulated with TPA (250 nM) for the indicated times. The cells were processed and stained as described above. Scale bar -15 µm. About 100 cells from each group in 10-12 random microscopic fields were monitored. The graph represents percent of cells in which GFP-ERK2 was mostly localized in the nucleus. The statistical difference of cells with SPA mutant compared to WT-ERK2 at 15 min after stimulation was assessed by student T-test. * P<0.01. P-ERK, as well as ERK and MEK expression was examined using whole cell extract (lower Western blots). (B) Analysis of the nuclear translocation of GFP-ERK2 mutants by ImageStream. HeLa cells were co-transfected with pcDNA-MEK1 and the indicated GFP-ERK2 constructs. Thirty-six h after co-transfection the cells were serum-starved and then stimulated with TPA (250 nM) for 6 minutes. The treated as well as the non-treated control cells (100-170 per sample) were processed as described under Material and Methods and analyzed by ImageStream. The graph represents geographic mean of nuclear ERK fluorescence ± SE. * p<0.05.